Functional architecture
This diagram shows, on a single page, how Graphicient turns raw data into answers. Read it from the bottom to the top: data comes in at the bottom and reaches the users at the top.
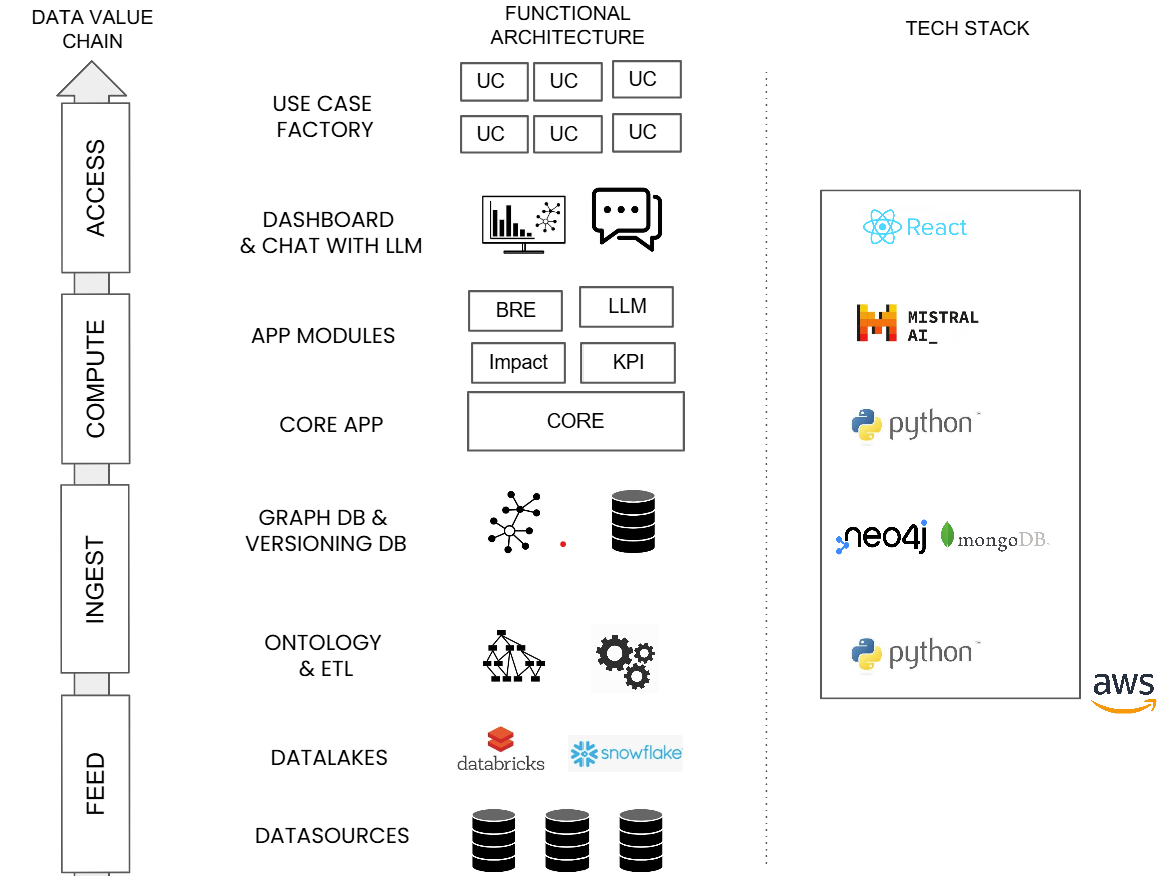
How to read the diagram
The diagram has three columns:
- Data value chain (left) — the 4 stages the data goes through: Feed, Ingest, Compute and Access
- Functional architecture (center) — the building blocks of the platform
- Tech stack (right) — the technologies used
The four stages
| Stage | What happens | Building blocks |
|---|---|---|
| Feed | Your data is collected where it already lives | Datasources (databases, files) and Datalakes (Databricks, Snowflake) |
| Ingest | The data is structured by the ontology and loaded into a graph | Ontology & ETL and Graph DB & versioning DB |
| Compute | The platform processes the graph | Core app and App modules (BRE, LLM, Impact, KPI) |
| Access | Users get the results | Dashboard & chat with LLM and Use case factory |
The building blocks, in simple terms
- Datasources and Datalakes — where your data comes from: company databases, files, or data platforms such as Databricks and Snowflake
- Ontology & ETL — the ontology describes your business domain; the ETL (extract, transform, load) takes the data from the sources and loads it into that structure
- Graph DB & versioning DB — the graph database stores your knowledge graph; the versioning database keeps track of its history
- Core app — the heart of the platform, on which all modules rely
- App modules — the specialized features: BRE (business rules), LLM (the AI that understands your questions), Impact (impact analysis) and KPI (indicators)
- Dashboard & chat with LLM — the screens used day to day: dashboards to explore the graph, and a chat to ask questions in natural language
- Use case factory — ready-to-use business use cases (UC) built on top of the platform
The tech stack in short
- React — the user interface
- Mistral AI — the language model
- Python — the core app and the data processing
- Neo4j and MongoDB — the databases
- AWS — the hosting
Where you find it in Graphicient
The four building blocks of the platform cover these layers: GraphForge for the ontology and the data loading, Explorer for the dashboards, KPI Forge for the indicators, and the AI Chatbot for the chat.